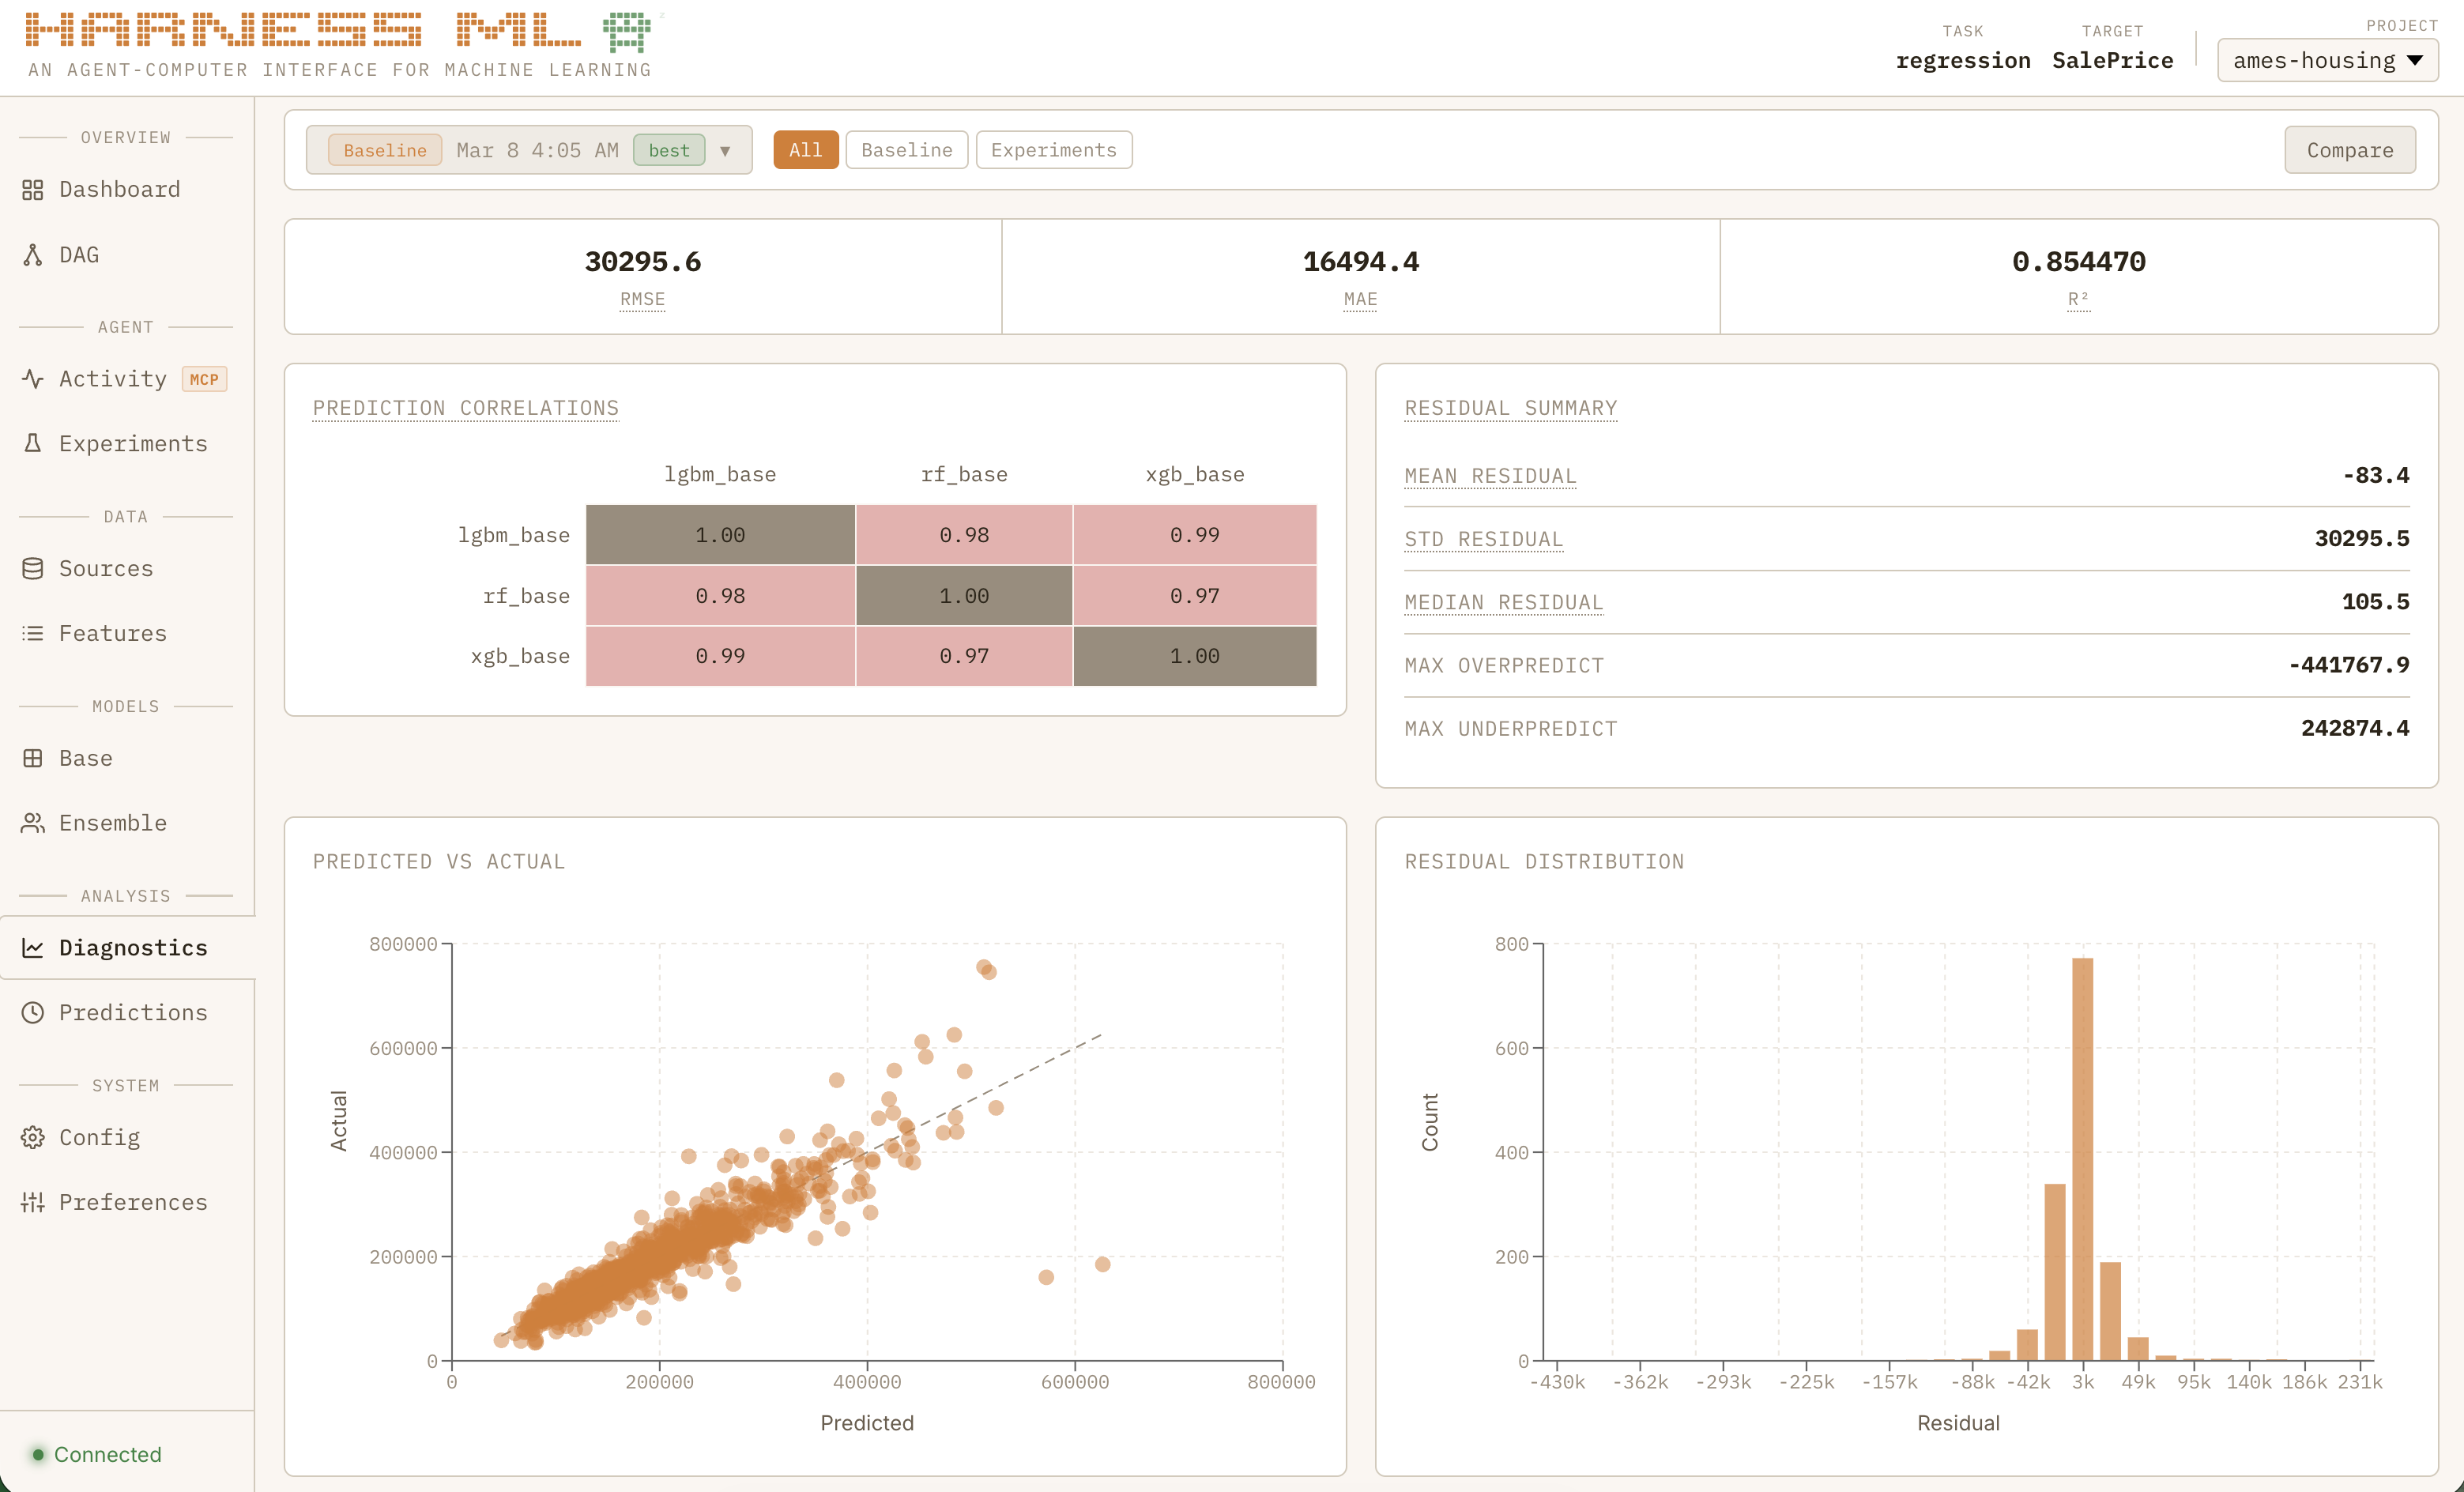
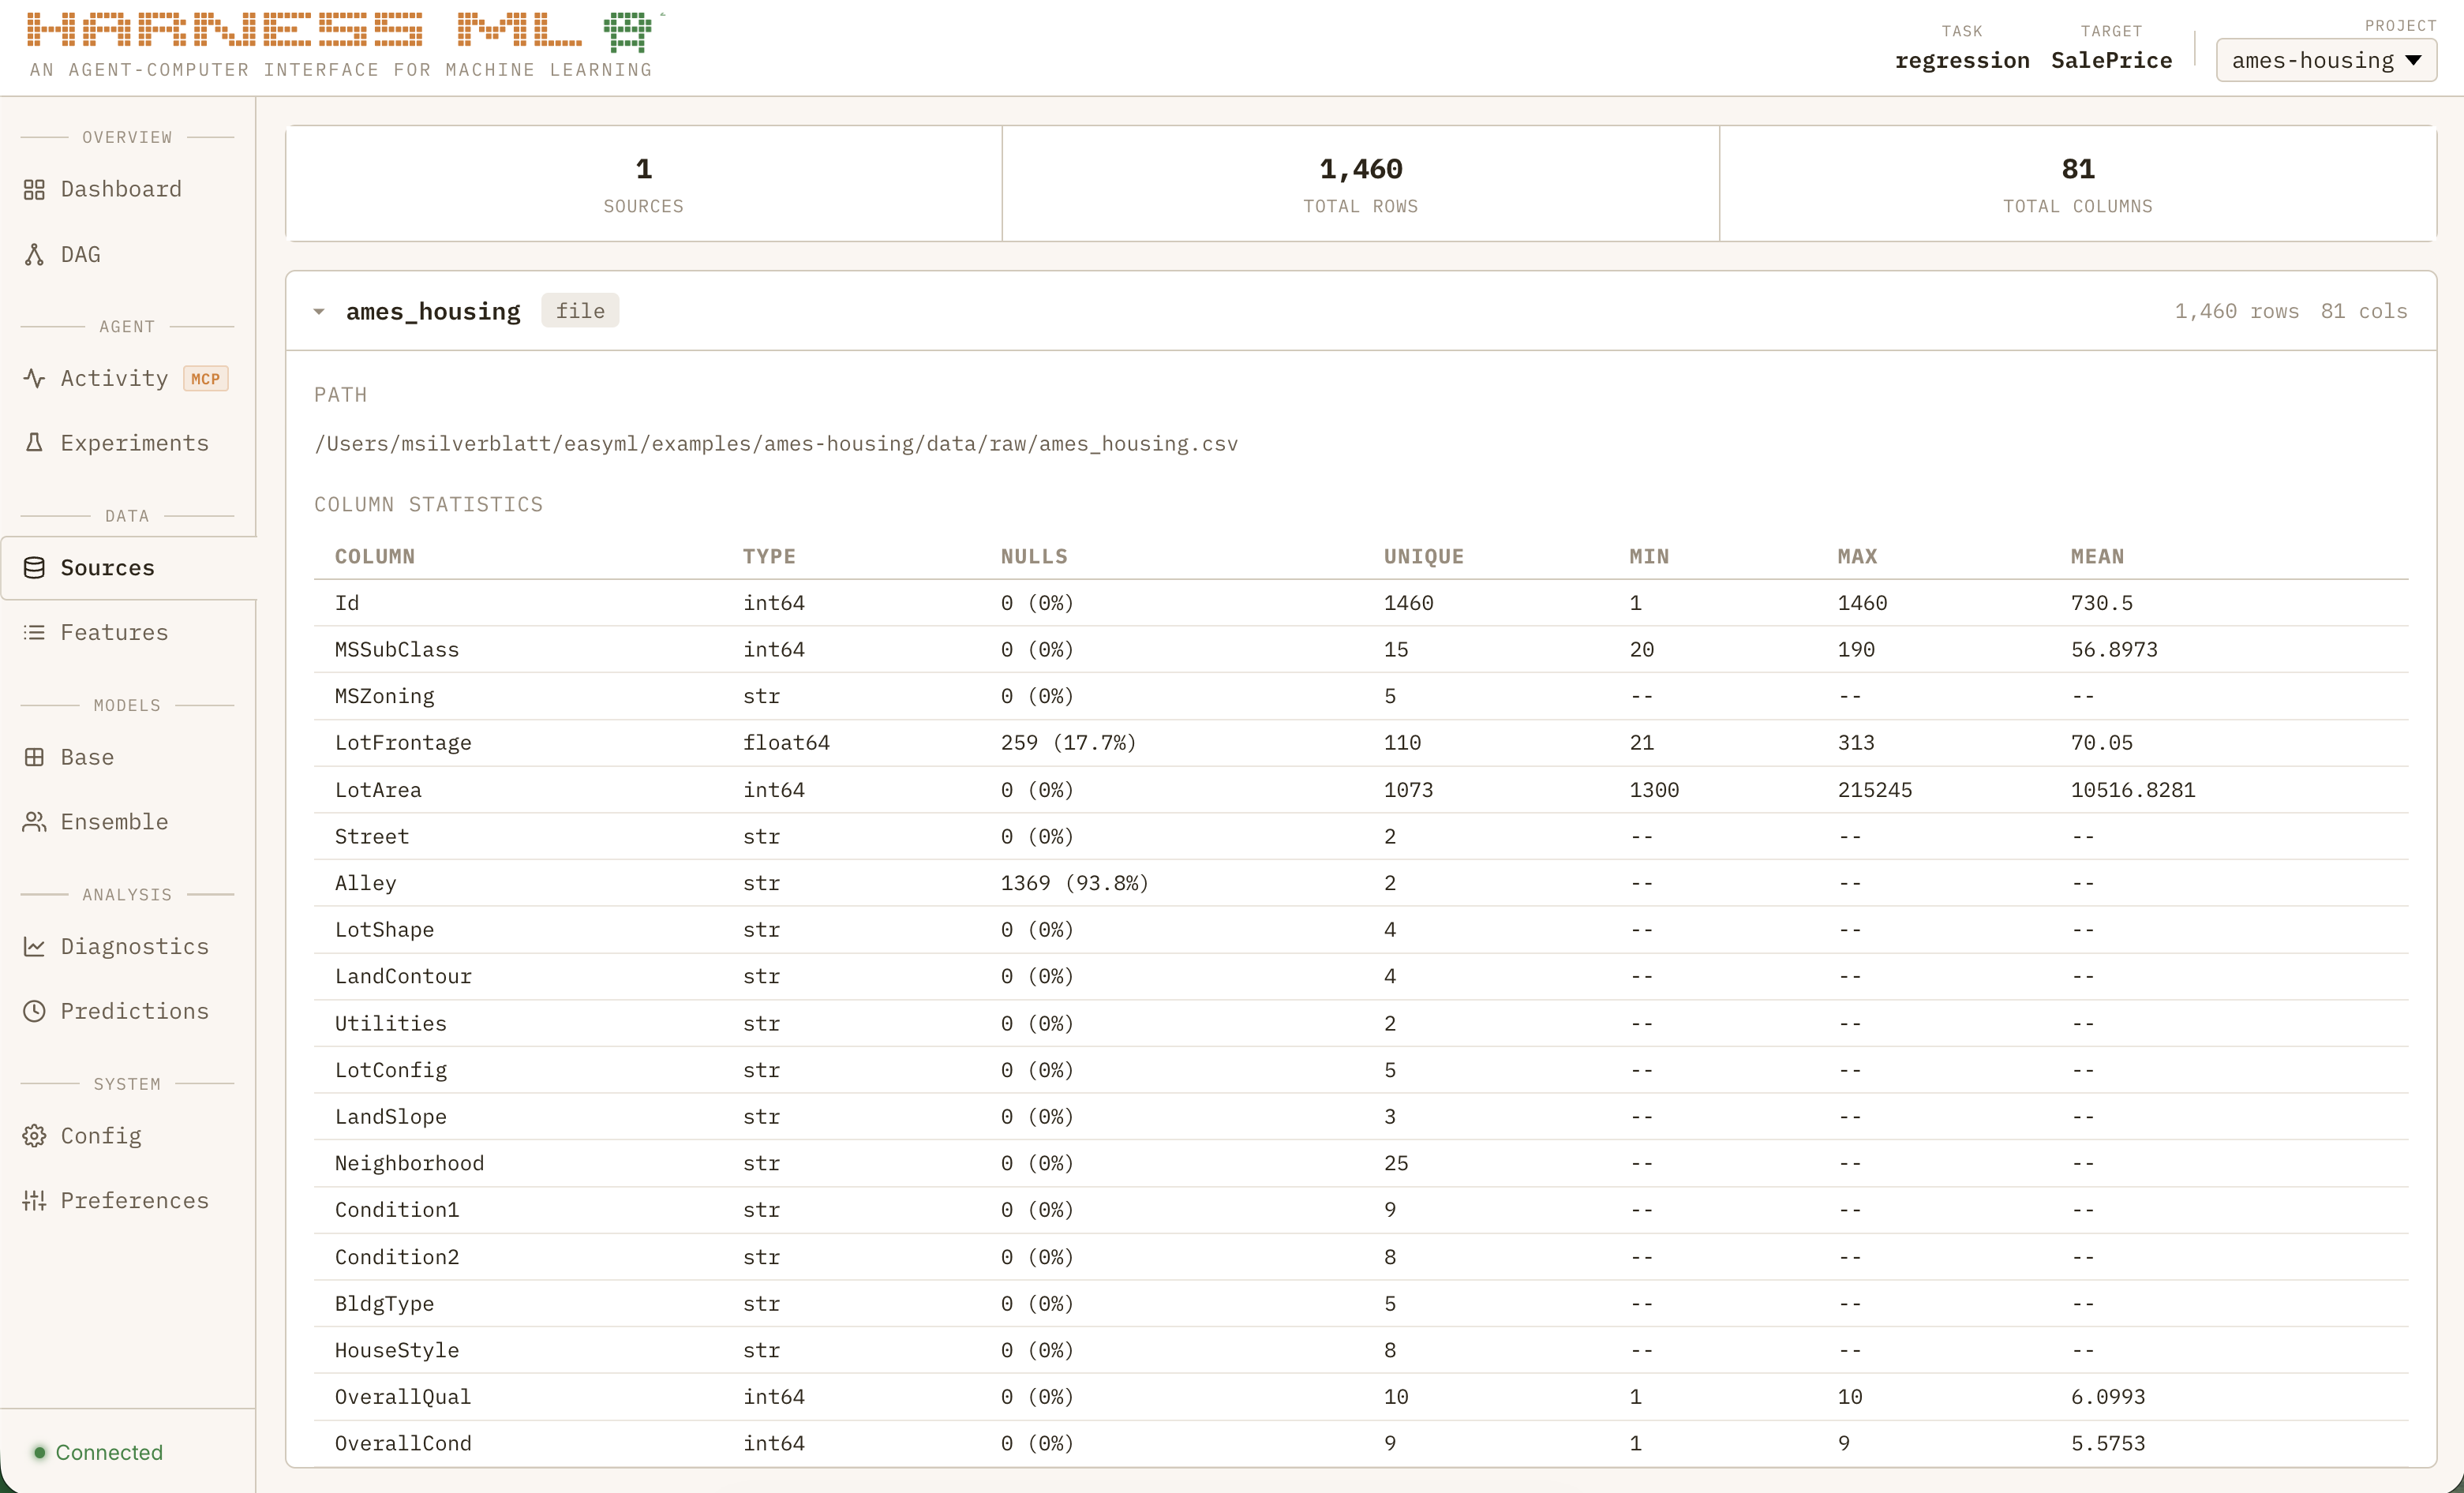
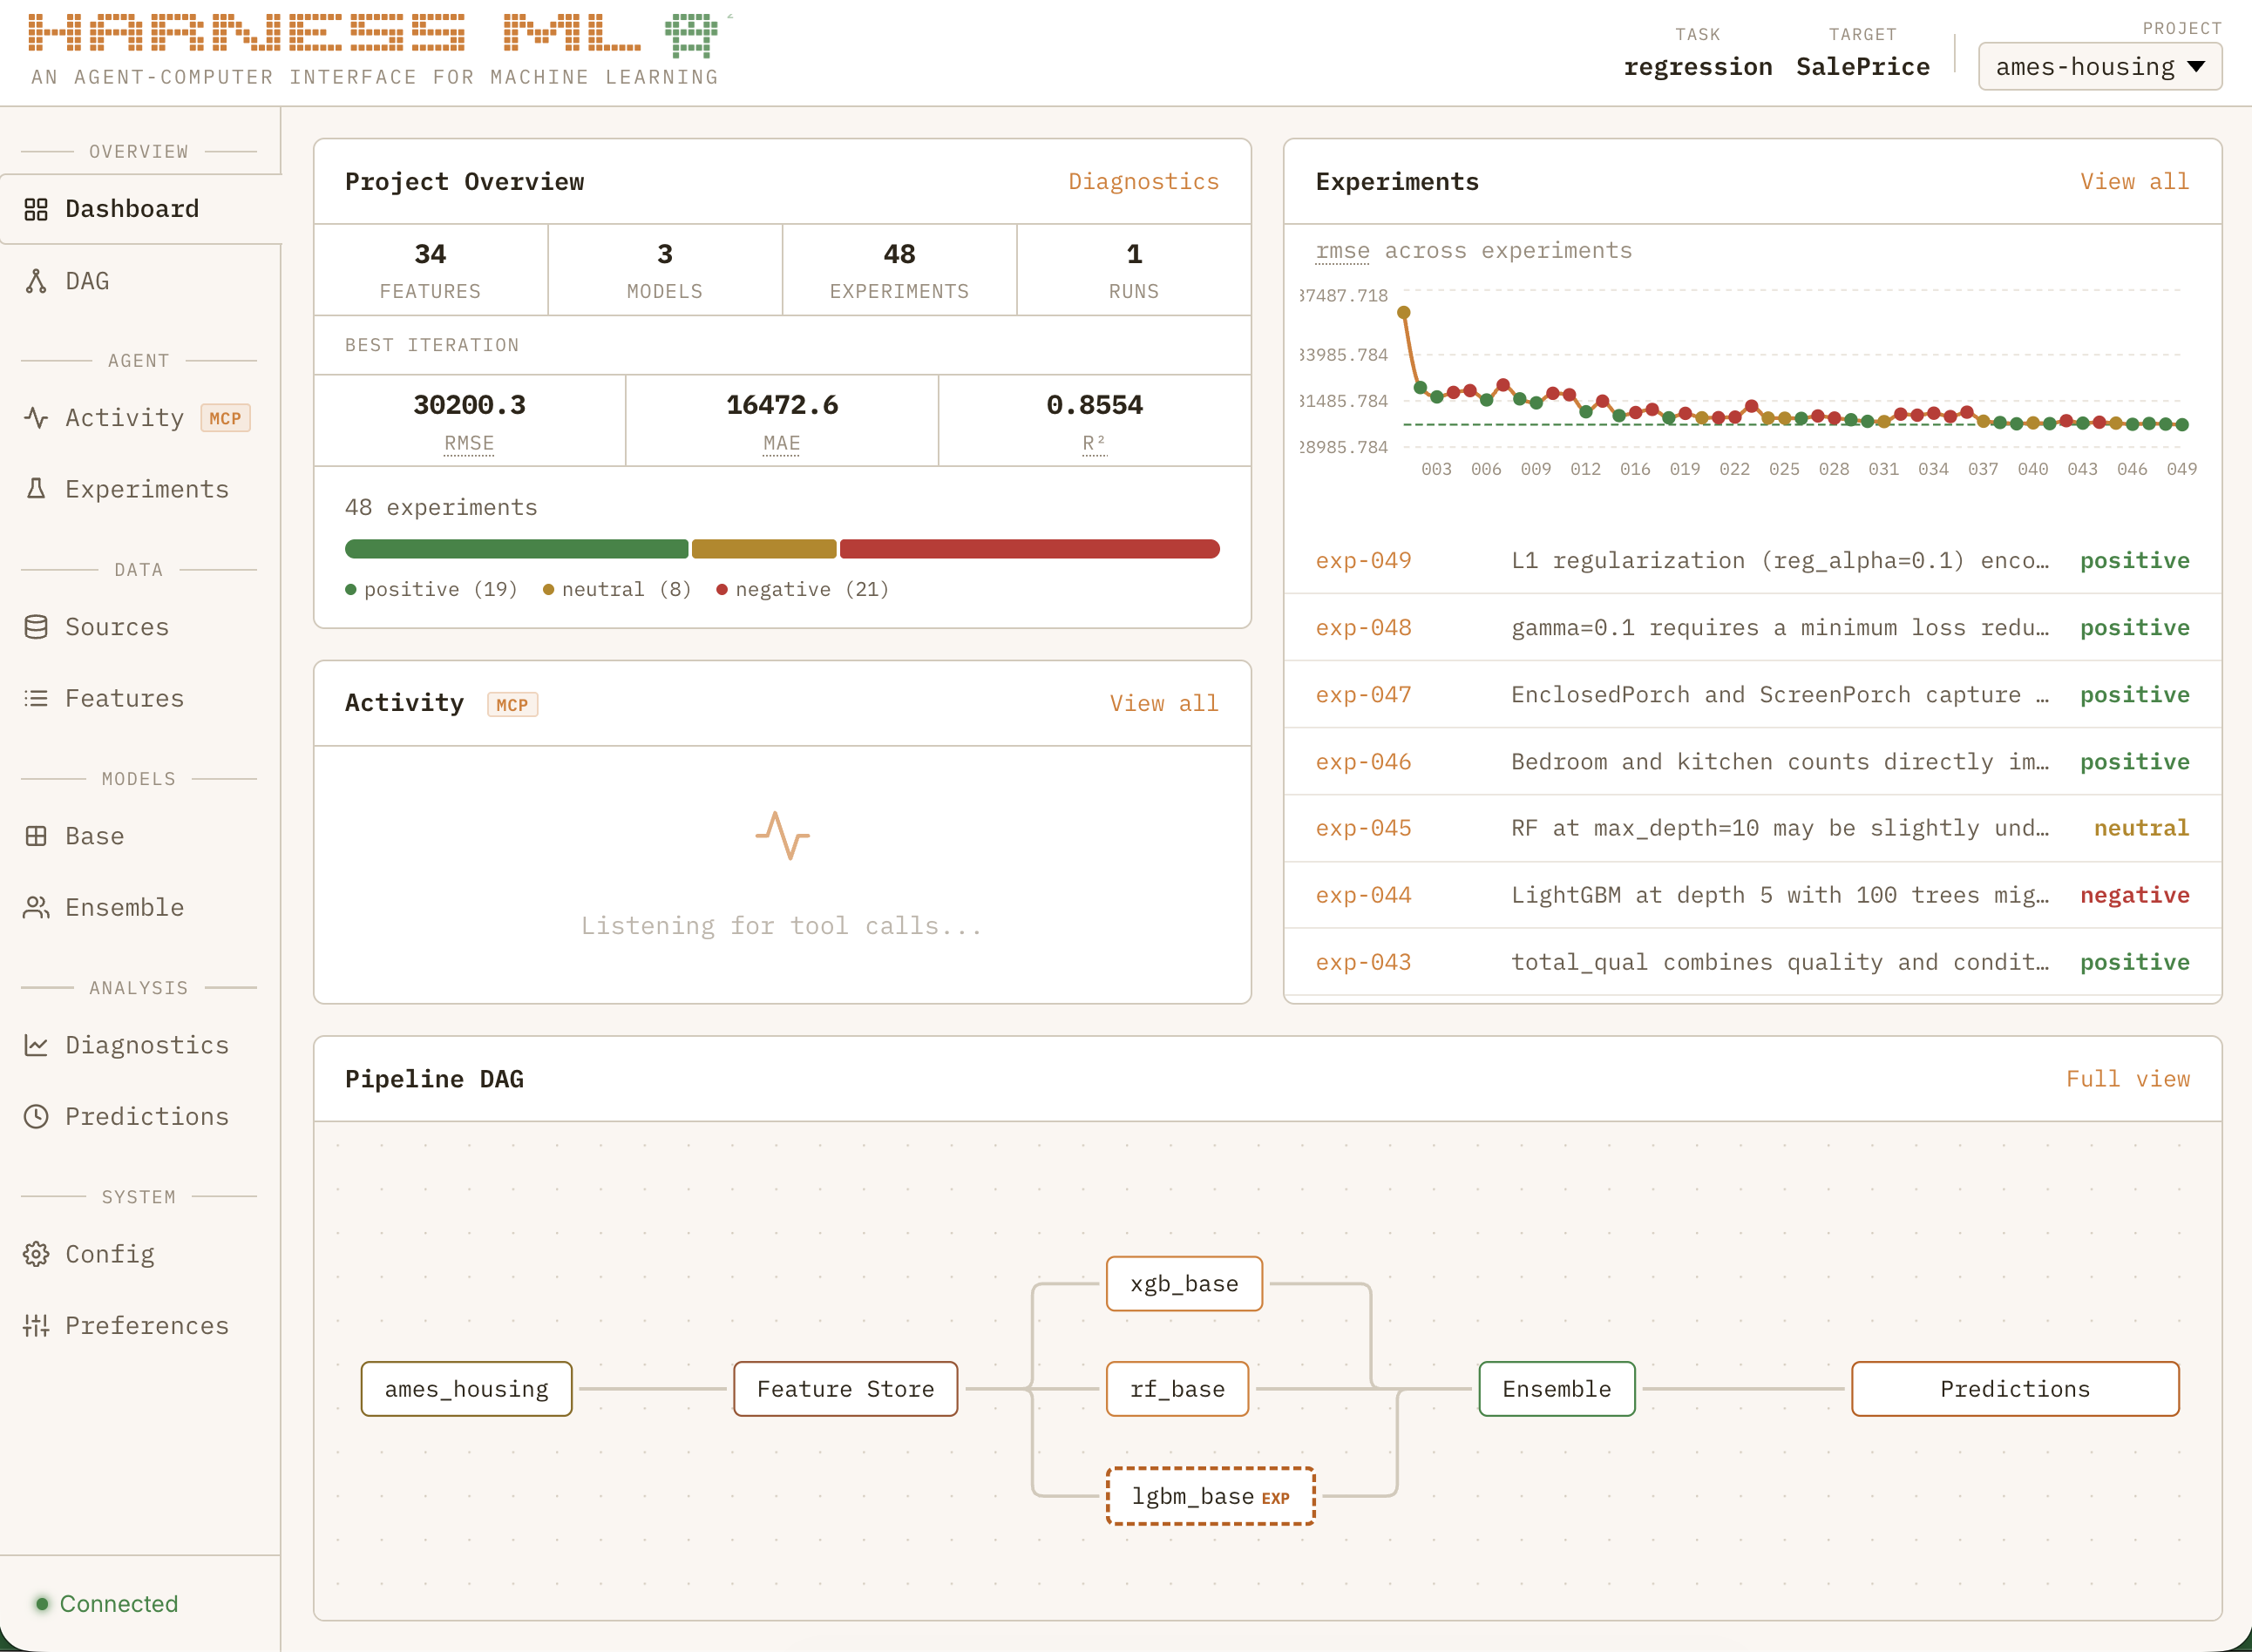
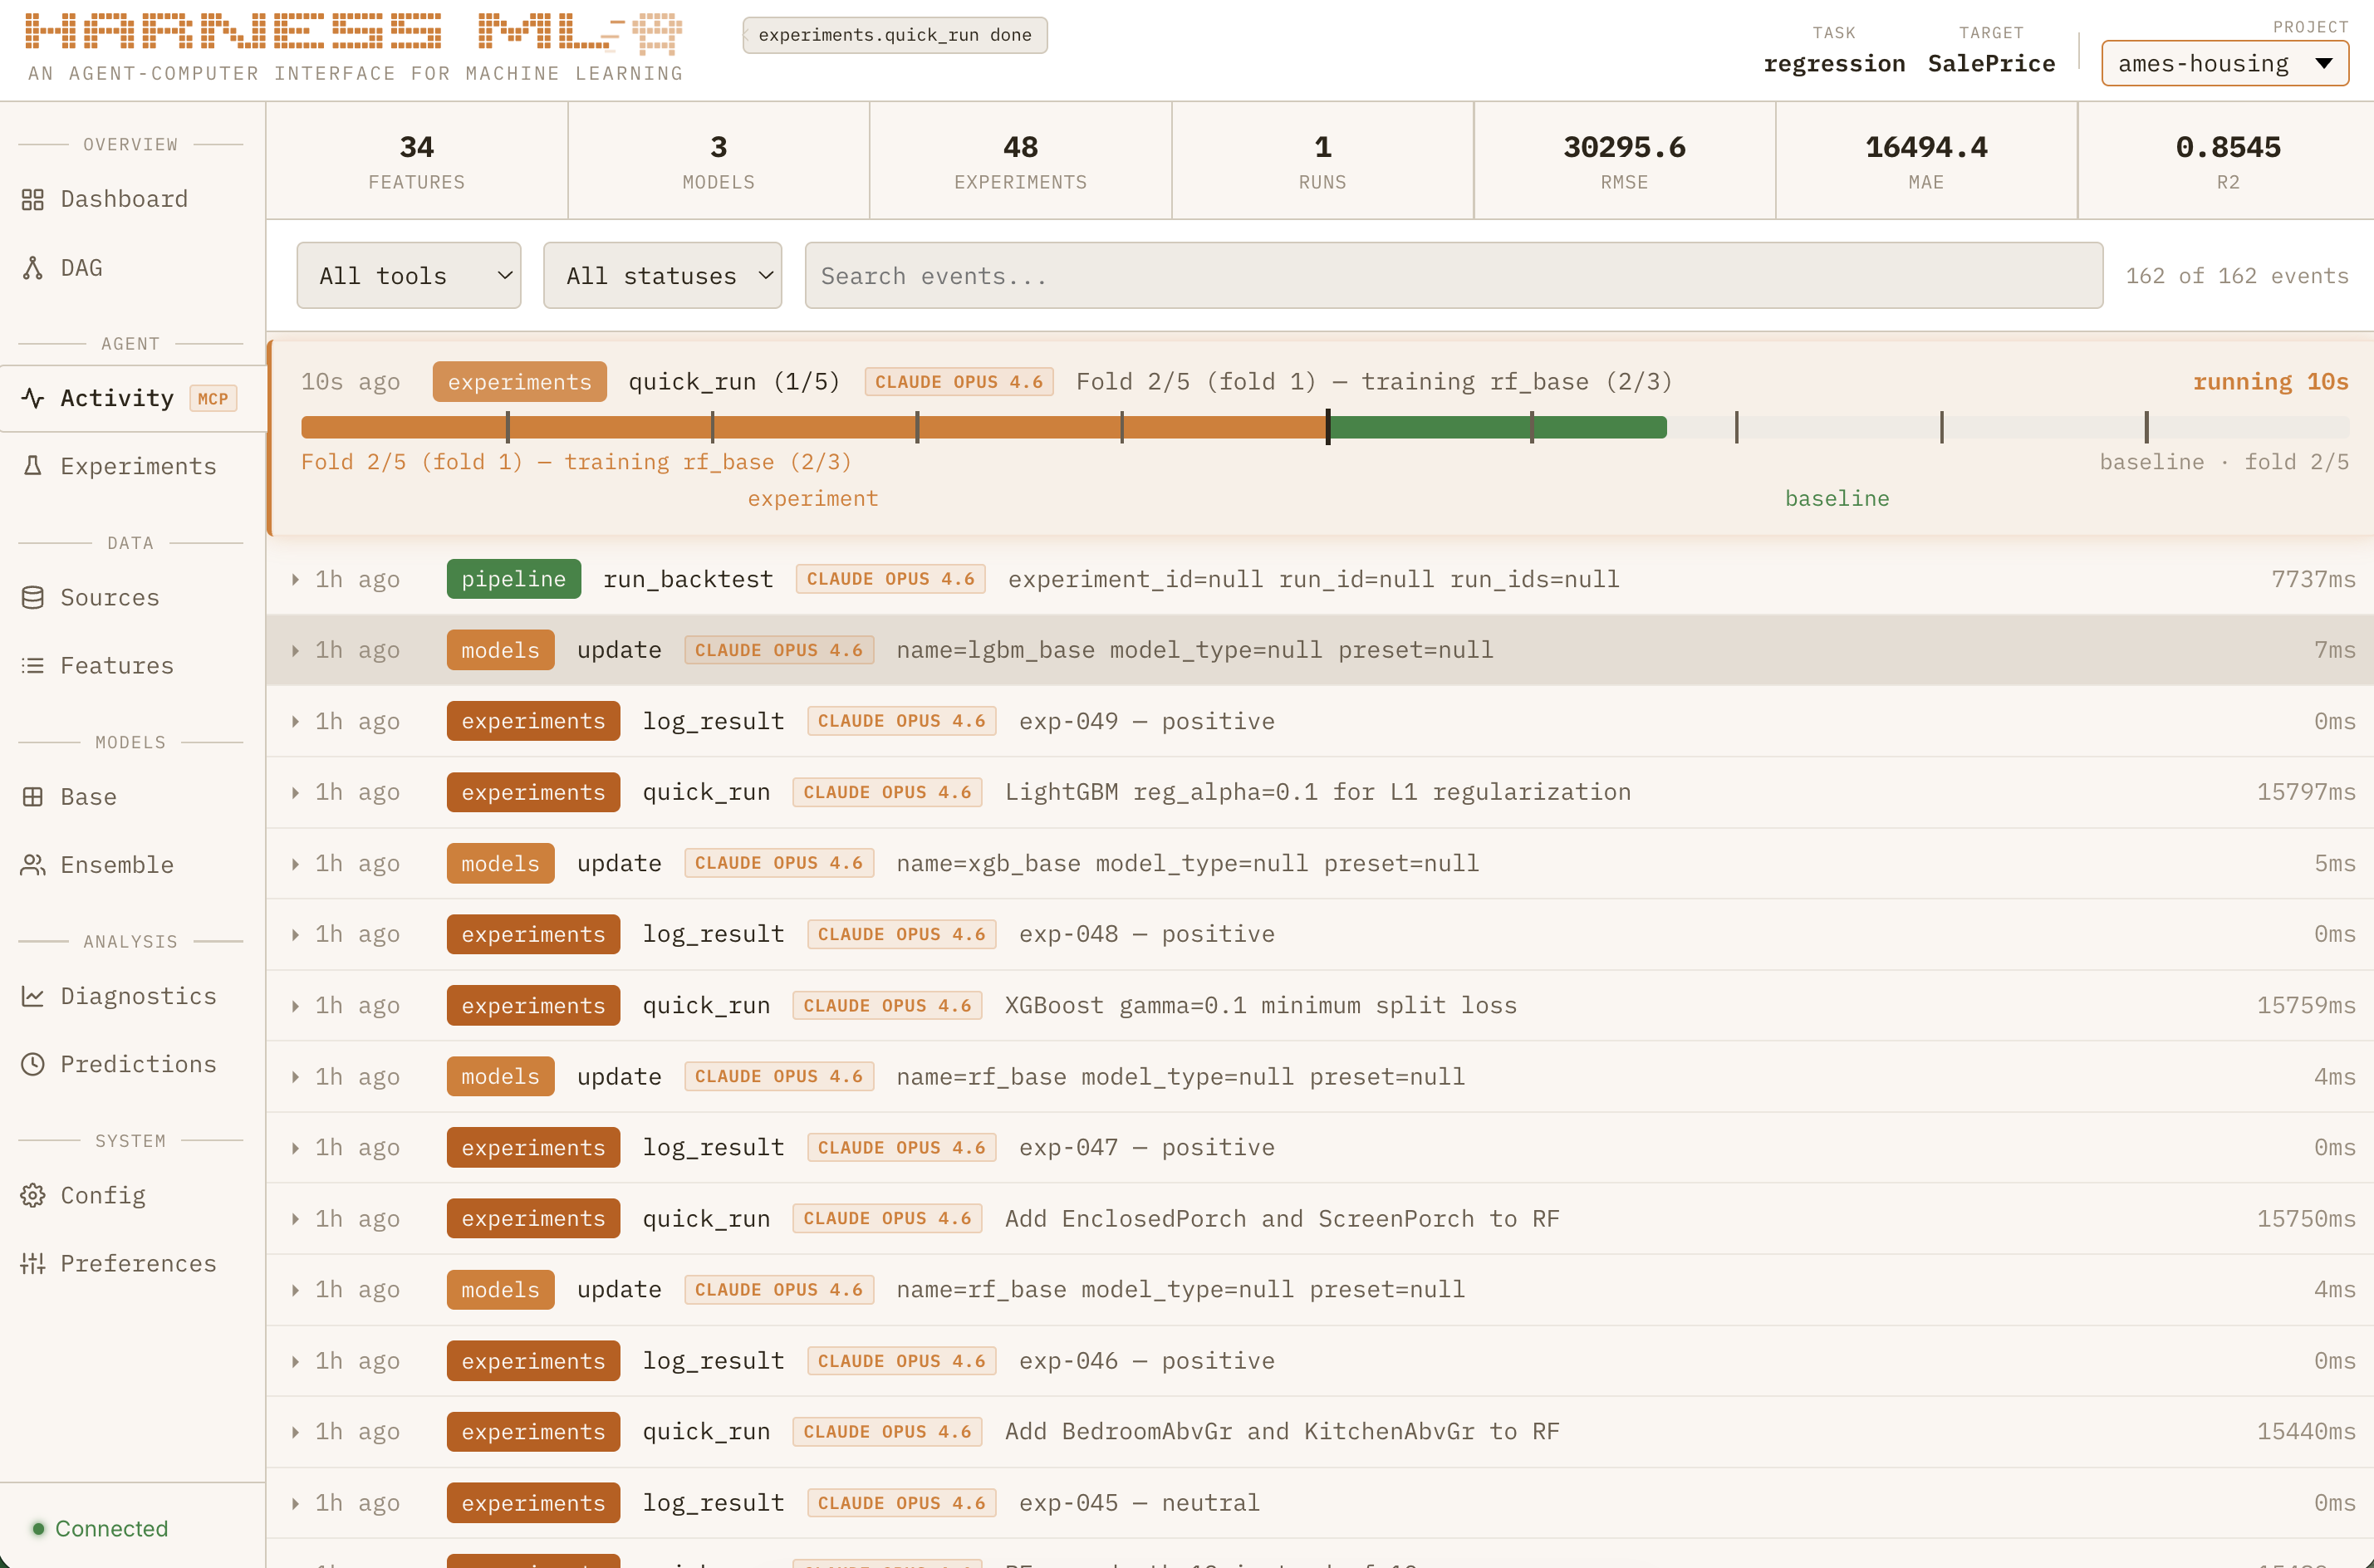
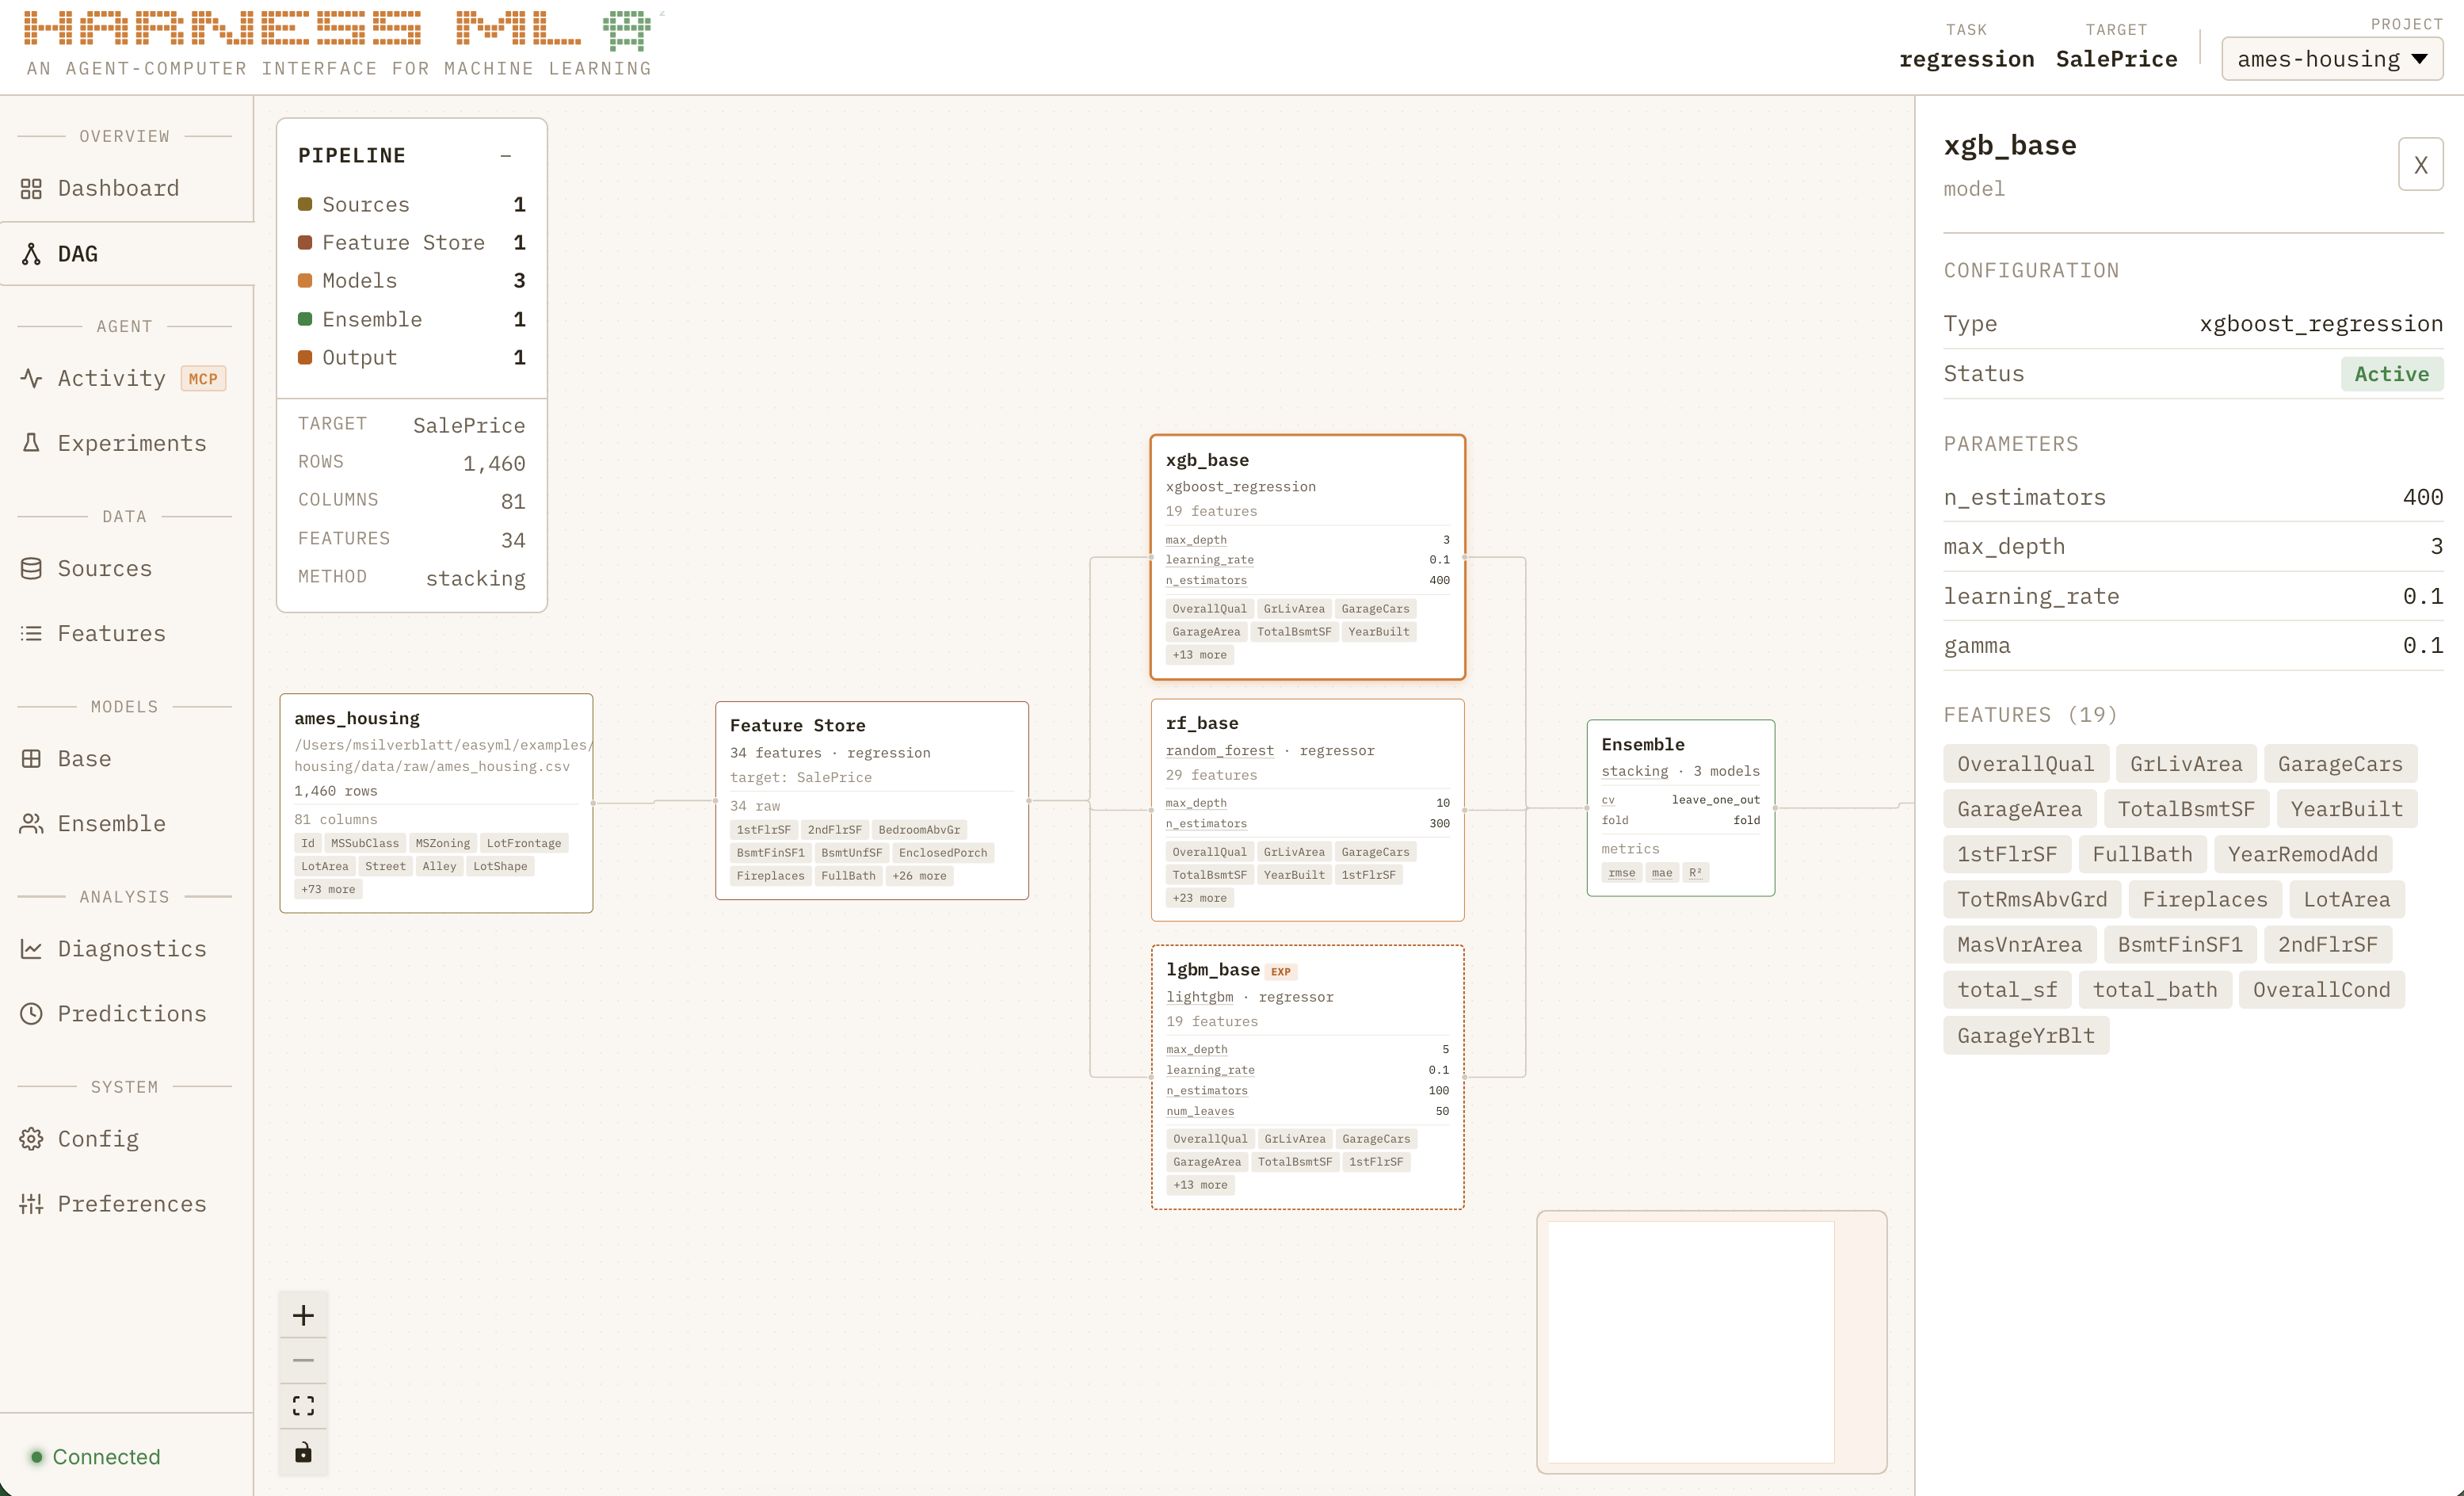
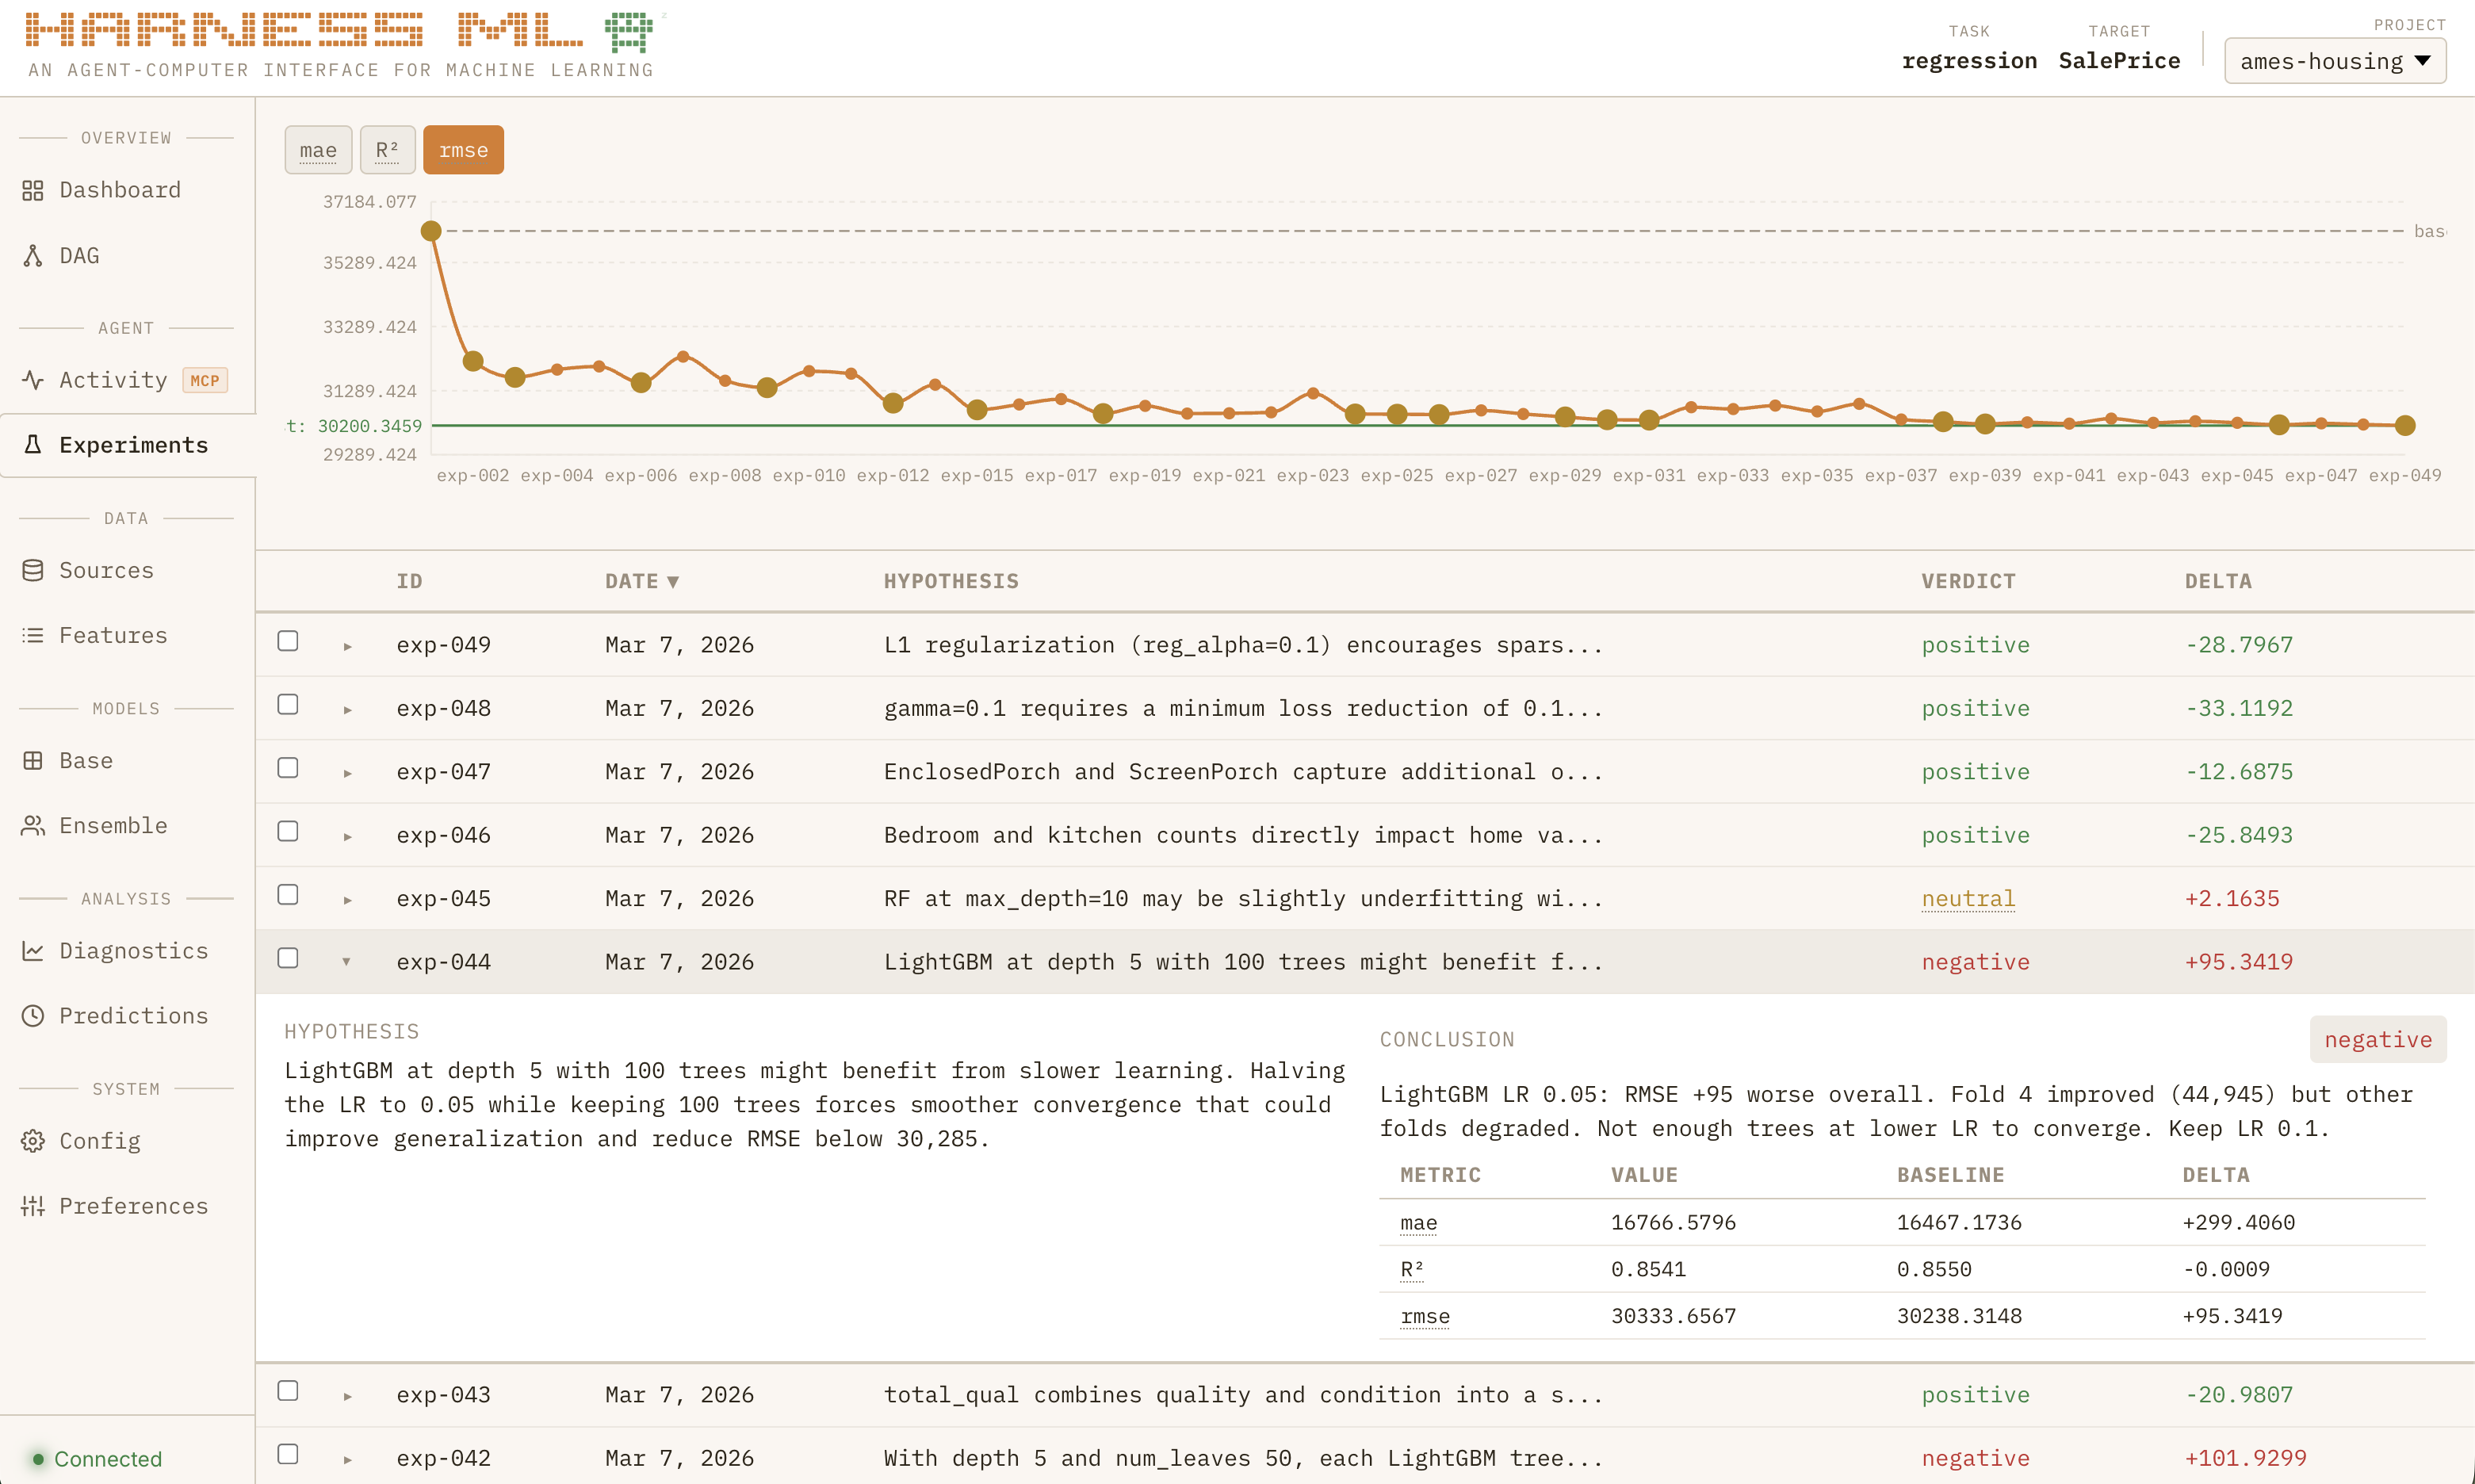
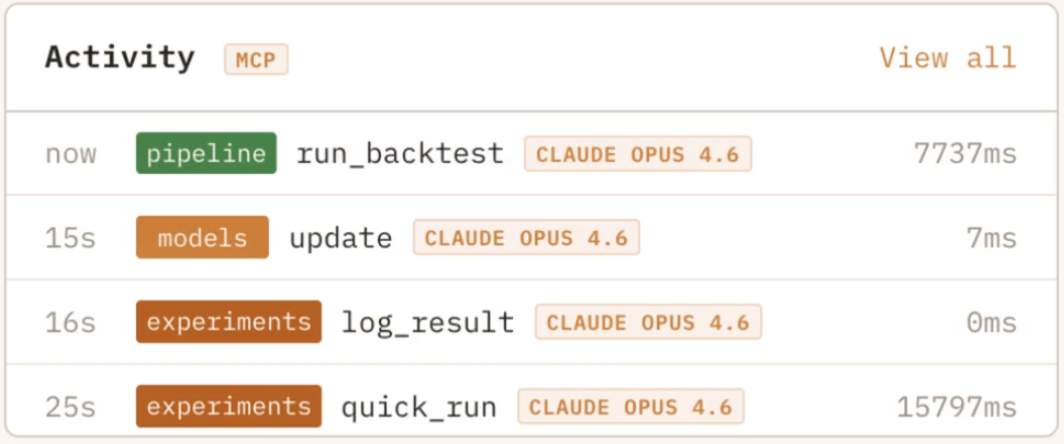
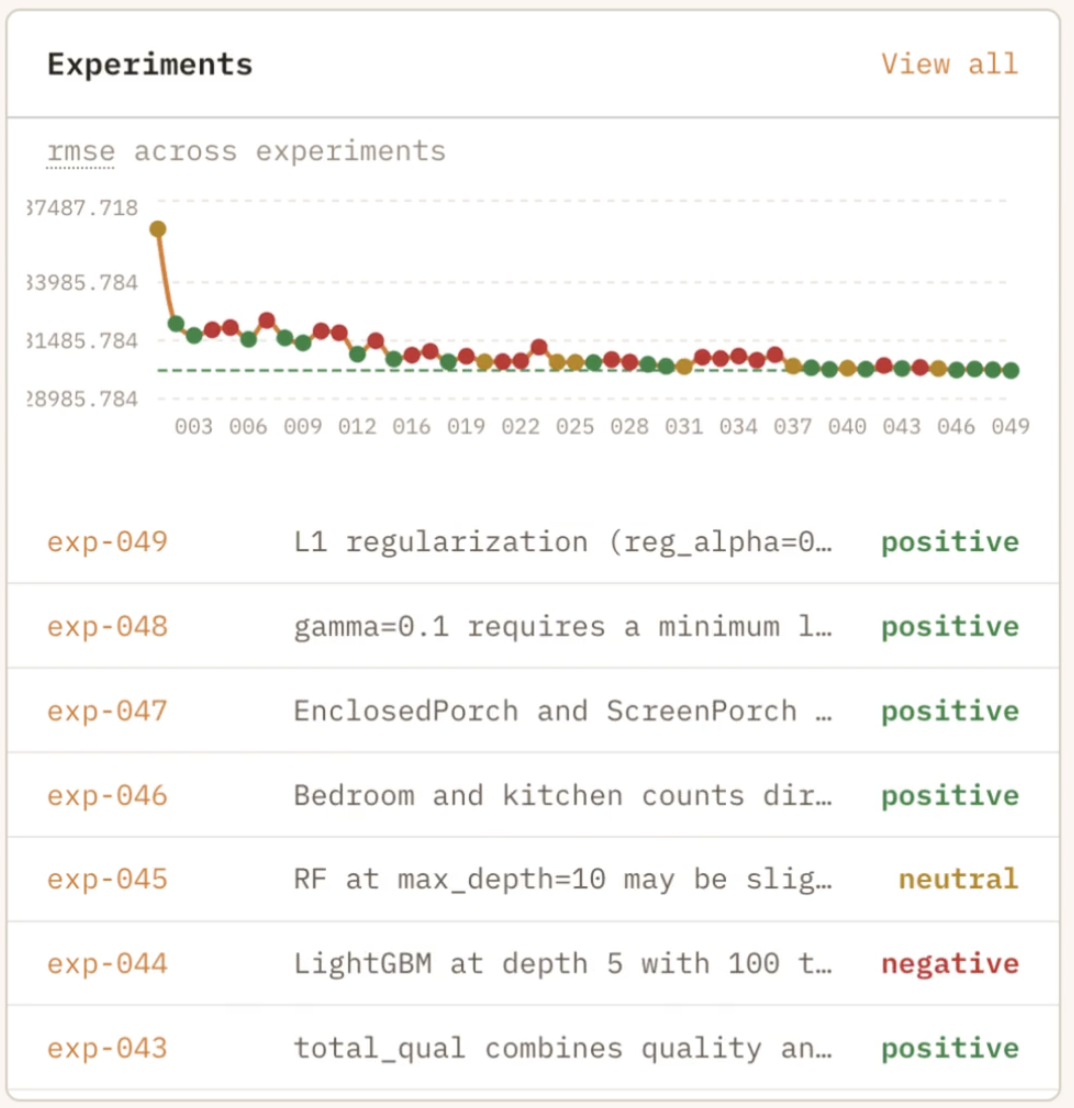
An MCP server that turns Claude into a disciplined data scientist. Structured tools, enforced methodology, real-time observability.
See it in actionA companion dashboard that runs alongside your agent, giving you full observability into every decision it makes — live, in real time.
Project vitals, experiment verdict breakdown, primary metric trend with error bars, live MCP activity feed, and a mini pipeline DAG — all updating as your agent works.
Every MCP tool call streamed live with full parameters and results. You see exactly what your agent is doing and why — no black box.
Interactive pipeline topology. Click any node for full config details. Models added by experiments show with dashed borders and EXP badges.
Every experiment with its hypothesis, verdict, and metric deltas. The trend chart tracks your primary metric across iterations — you can literally watch your agent get smarter.
Per-run deep dive: headline metrics, meta-learner coefficients, model correlation heatmap, calibration curves, and per-fold breakdown.
Overview of ingested data, registered features, and view definitions. Full transparency into the data pipeline.
Just tell Claude what you want to predict.